Changeflow vs Dividend Data
Changeflow
Changeflow's AI tracks critical website changes for you, eliminating manual checks and false alerts.
Last updated: March 4, 2026
Visual Comparison
Changeflow
Dividend Data
Overview
About Changeflow
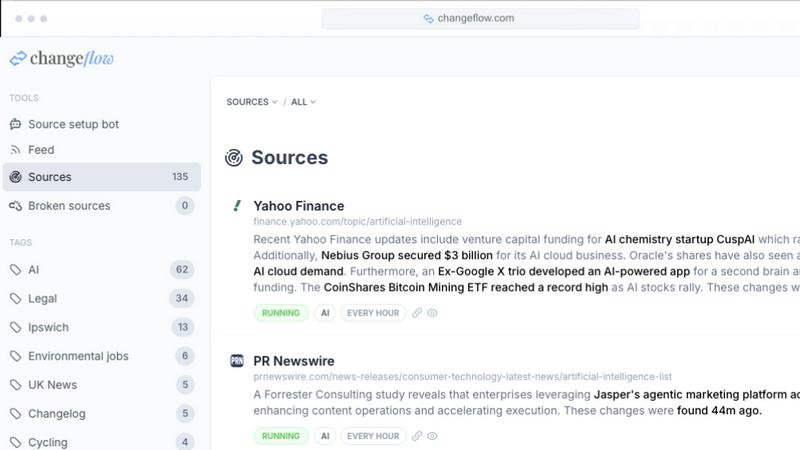
Changeflow is the battle-tested web monitoring platform that goes beyond simple change detection to deliver intelligent, actionable intelligence. While other tools bombard you with screenshots and vague "something changed" alerts, Changeflow's AI reads and comprehends web pages like a human expert. It understands context, filters out irrelevant noise, and delivers clear, concise summaries of exactly what changed and why it matters to your business. Designed for professionals who can't afford to miss a beat, it transforms the tedious task of manual website checking into a strategic advantage. Setup is effortless: simply describe what you want to track in plain English and point Changeflow at a starting page. The platform then handles the complex work, including navigating login walls, executing JavaScript, and intelligently following links to build a comprehensive feed of updates. Trusted by Fortune 500 compliance teams and Am Law 200 legal librarians, Changeflow offers enterprise-grade reliability, shared team workspaces, full API access, and a unique Site Version Control for navigating timestamped page archives. This isn't a hobbyist tool with features bolted on; it's a purpose-built solution that has already checked over 1 billion pages, saving customers more than 125,000 hours.
About Dividend Data
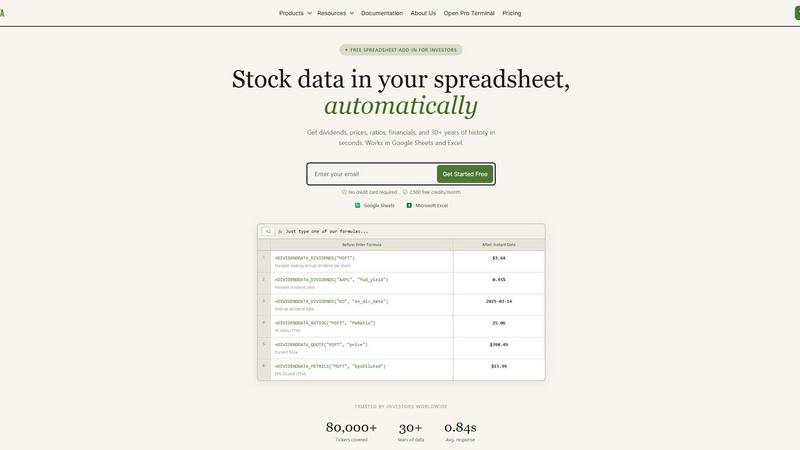
Dividend Data brings 30+ years of stock market data for 80,000+ tickers directly into your Google Sheets and Microsoft Excel spreadsheets — no API keys, no coding, no copying and pasting.
Built for dividend & fundamental investors, it gives you instant access to dividends, yields, payout ratios, growth rates, financial statements, earnings, ratios, price history, and 100+ metrics through simple custom formulas.
Just type a formula. The data appears live.
What makes it different:
• Free tier with 2,500 monthly credits — no trial expiration
• 16 custom functions covering everything dividend investors need
• 30+ years of historical data
• Works in both Google Sheets and Microsoft Excel
• Built by a dividend investor, for dividend investors
Used by fundamental investors who want institutional-grade data without the institutional price tag.