Dividend Data vs Tradepal
Dividend Data
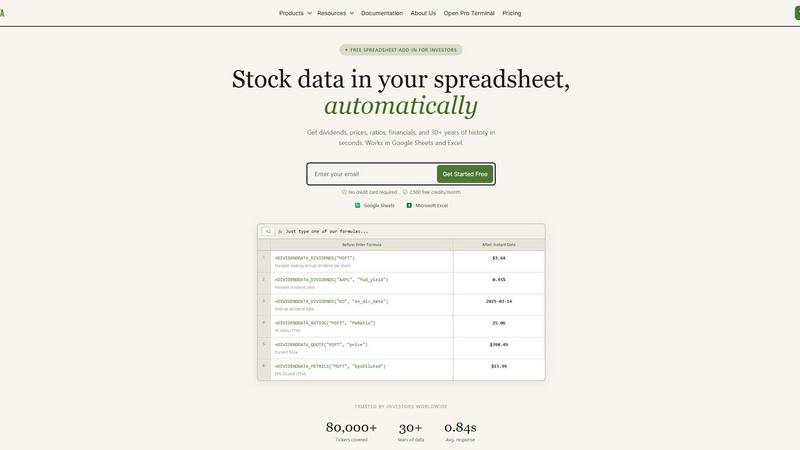
Stop manually updating spreadsheets; our battle-tested formulas instantly deliver dividends, prices, and financials directly into Excel and Google.
Last updated: March 11, 2026
Tradepal
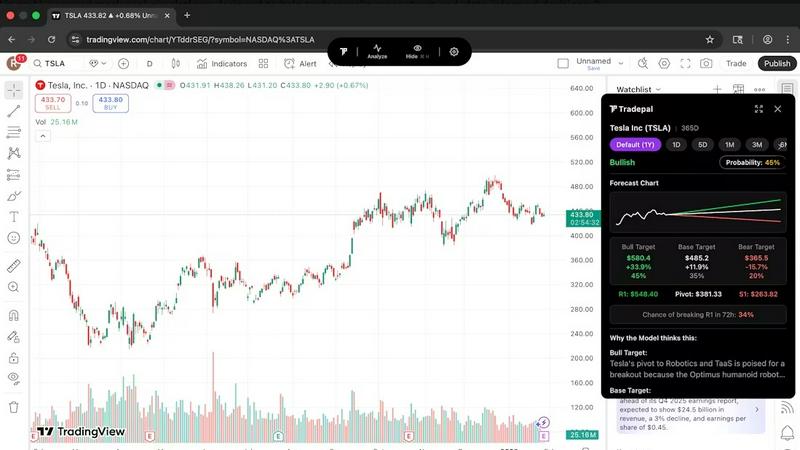
Tradepal is your AI trading co-pilot, delivering real-time insights, forecasts, and analysis to enhance your trading.
Last updated: February 28, 2026
Visual Comparison
Dividend Data
Tradepal
Feature Comparison
Dividend Data
Comprehensive Dividend Intelligence Engine
Go beyond basic yield. This feature delivers the deep, forward-looking data dividend investors crave. Access forward annual dividend amounts, yields, payout ratios, growth rates, and critical dates like ex-dividend and payment dates for any stock instantly. It's built specifically to analyze the sustainability and growth trajectory of income streams, putting professional-grade dividend analytics at your fingertips with a single formula.
Deep Historical Financials & Ratios
Conduct thorough fundamental analysis without leaving your spreadsheet. Pull in 30+ years of historical data from income statements, balance sheets, and cash flow statements. Instantly calculate and retrieve essential valuation and health metrics like P/E Ratio, Price-to-Book, Debt-to-Equity, and Return on Equity. This turns your sheet into a dynamic financial modeling platform, allowing for robust back-testing and trend analysis.
Live Price & Market Data Integration
Keep your portfolio tracking and valuation models perpetually up-to-date. With simple functions, pull real-time or delayed closing prices, market capitalization, and daily price history. This seamless integration ensures your net worth calculations, performance charts, and alert systems are always reflecting the live market, eliminating manual data entry errors and outdated information.
Universal Spreadsheet Compatibility
Why choose between ecosystems? Dividend Data delivers identical, powerful functionality in both Google Sheets and Microsoft Excel. Whether your team uses Google Workspace or your models are built in Excel, you get the same reliable formulas, data quality, and user experience. This flexibility ensures no investor is left behind and allows for seamless collaboration across different platforms.
Tradepal
AI Forecasts
Tradepal provides intraday forecasts for ranges, reversals, and volatility by employing a blended ensemble of AI models. These forecasts are updated in real time, allowing traders to identify potential risks before they materialize in market prices.
Price Cone Projections
With Tradepal's price cone projections, traders can visualize forward price ranges directly on their charts. This feature supports a fast and intuitive layout that can be personalized to fit individual trading styles, enhancing usability and efficiency.
News and Sentiment Analysis
Stay ahead of market trends with Tradepal's comprehensive news and sentiment analysis. This feature aggregates information from professional trader sources and financial news, helping users gauge market mood and recognize shifts in crowd conviction before they trigger significant price movements.
Breakout Signals
Tradepal enables traders to detect early signals of strength or potential failures through live sentiment streams, order flow hints, and momentum shifts. This feature empowers traders to capitalize on emerging trends before they fully develop, enhancing trading opportunities.
Use Cases
Dividend Data
Automated Dividend Portfolio Tracking
Manually updating a portfolio of income stocks is a tedious chore. Investors use Dividend Data to build a live dashboard that automatically tracks dividend payments, yields-on-cost, projected annual income, and ex-dividend calendars. This automates the entire monitoring process, providing a real-time view of portfolio income health and freeing up hours for analysis instead of data entry.
Screening and Building Watchlists
Quickly filter the universe of 80,000+ stocks based on precise, live criteria. Use the formulas to create dynamic screens for stocks meeting specific conditions, such as a P/E ratio under 20, a dividend yield above 3%, and a payout ratio below 60%. This allows investors to systematically identify new opportunities based on the latest data without relying on third-party screeners with limited metrics.
Streamlined Fundamental Research Reports
When analyzing a company for a potential investment, gathering data from multiple sources is inefficient. With Dividend Data, an investor can create a standardized research template in a spreadsheet. By simply entering a ticker symbol, the template auto-populates with decades of financials, key ratios, and dividend history, creating a comprehensive, consistent report in seconds.
Dynamic Financial Modeling & Projections
Build more accurate and responsive financial models. By linking valuation models directly to live data feeds for revenue, EPS, and growth rates, analysts can ensure their assumptions and projections are grounded in the latest reported figures. This creates living models that adjust as new quarterly data is released, providing a significant edge in investment thesis development.
Tradepal
Day Trading Strategies
For day traders looking to make rapid decisions, Tradepal offers real-time analysis and forecasts, allowing them to identify entry and exit points quickly. The AI-generated insights reduce the time spent on manual analysis and enhance decision-making.
Swing Trading
Swing traders can leverage Tradepal's ability to analyze chart patterns and forecast price movements over a few days or weeks. This allows them to position their trades more effectively, increasing their chances of capturing significant price swings.
Risk Management
Risk-averse traders can use Tradepal's sentiment analysis and breakout signals to manage their portfolios better. By identifying potential market movements and risks, they can adjust their positions proactively to protect their investments.
Stock Research and Validation
Investors conducting stock research can utilize Tradepal to validate their findings. By getting an AI-generated second opinion on stock charts, they can confirm their analysis and make more confident investment decisions based on objective data.
Overview
About Dividend Data
Forget clunky APIs, expensive terminals, and the endless copy-paste grind. Dividend Data is the battle-tested spreadsheet weapon built for one purpose: to give self-directed investors institutional-grade market intelligence without the institutional complexity or price tag. This is not just another data feed; it's a complete operational system designed by a dividend investor for fundamental analysts who live in Google Sheets and Microsoft Excel. The core value proposition is ruthless efficiency: you get instant, live access to over 30 years of historical data for 80,000+ tickers directly in your cells through simple, plain-English formulas. No coding, no API keys, no manual updates. Just type a function like =DIVIDENDDATA_DIVIDENDS("MSFT") and watch the forward dividend, yield, ex-date, or payout ratio populate instantly. It brings together dividends, yields, full financial statements, key ratios, earnings, and price history—over 100 metrics—transforming your spreadsheet from a static record into a dynamic, real-time research and portfolio tracking powerhouse. With a permanently free tier offering 2,500 monthly credits and seamless integration across both major spreadsheet platforms, Dividend Data democratizes high-quality financial data, empowering investors to make faster, more informed decisions with confidence.
About Tradepal
Tradepal is an innovative AI-powered trading assistant designed specifically for active traders and investors who seek precision in chart analysis without the burden of manual guesswork. By analyzing any U.S.-listed stock chart in real-time, users can click "Analyze" or upload a screenshot to receive automated insights. Tradepal excels in detecting key technical patterns, support and resistance levels, trend strength, and momentum indicators, producing clear scenarios for bullish, base, and bearish movements, complete with confidence scores and price targets. Unlike traditional trading platforms that execute trades, Tradepal acts as a second set of eyes, enabling traders to validate their strategies, minimize emotional biases, and make well-informed decisions efficiently. The platform is lightweight and designed to integrate seamlessly into existing trader workflows, making it ideal for those who want to enhance their trading experience without altering their methods.
Frequently Asked Questions
Dividend Data FAQ
Is there really a free plan, and what does it include?
Absolutely. The free tier is a permanent offering, not a limited trial. It provides 2,500 credits per month at no cost and with no credit card required. This is ample for most individual investors to track a portfolio, research several companies, and automate key data in their spreadsheets, making professional-grade analysis accessible to everyone.
How does Dividend Data compare to using free Yahoo Finance or Google Finance data?
While those sources are free, they are notoriously unreliable, inconsistent, and often lack the depth and history serious investors need. Dividend Data provides clean, standardized, and battle-tested data directly into your spreadsheet cells with 30+ years of history. You trade the fragility of web scraping and manual copying for robust, automated, and institutional-quality data feeds.
Do I need to know how to code or set up an API?
Not at all. Dividend Data requires zero coding knowledge. The entire system runs on simple, custom spreadsheet functions (like =DIVIDENDDATA_QUOTE("AAPL", "price")). If you know how to type a formula in Excel or Google Sheets, you can use all its features. There are no APIs to manage, authenticate, or troubleshoot.
Is my data secure and private?
Yes. Dividend Data operates with a strong commitment to privacy. Your spreadsheet data and portfolio holdings are not stored on their servers. The add-in fetches public market data based on the formulas you type. You maintain full control and ownership of your financial models and investment information at all times.
Tradepal FAQ
How do I use Tradepal?
After signing up, you can download Tradepal for macOS or Windows, keeping it accessible while you trade. If you prefer not to download, simply upload a screenshot of any U.S.-listed stock chart to the web platform for instant AI-powered analysis.
Is Tradepal financial advice?
No, Tradepal does not provide financial advice. It serves as an analytical tool designed to assist traders in making informed decisions based on AI-generated insights and data.
What charts are compatible with Tradepal?
Tradepal is compatible with any chart from popular trading platforms, allowing users to analyze any U.S.-listed stock charts quickly and efficiently without restrictions.
Do I need trading experience to use Tradepal?
While having trading experience can be beneficial, Tradepal is designed for traders of all levels. Its intuitive interface and AI-driven insights can help beginners learn and improve their trading skills while providing experienced traders with a valuable edge.
Alternatives
Dividend Data Alternatives
Dividend Data is a specialized spreadsheet add-on that delivers live, institutional-grade stock market data directly into Google Sheets and Excel. It belongs to the category of financial data tools built for self-directed, fundamental investors who prioritize dividends and long-term analysis. Users often explore alternatives due to budget constraints, the need for different data points, or compatibility issues with other platforms like portfolio trackers. When evaluating other tools, savvy investors should scrutinize the depth of historical data, the transparency of pricing beyond free trials, and the simplicity of the user experience. The core value lies in eliminating manual data entry; therefore, any true alternative must offer seamless, formula-driven access without requiring coding skills or constant maintenance. The right solution should feel like a natural extension of your analysis workflow, not a complicated piece of financial software. Focus on tools that understand the specific needs of dividend growth investing, providing not just raw numbers but the critical metrics—like payout ratios and dividend growth streaks—that inform sound investment decisions.
Tradepal Alternatives
Tradepal is an AI-powered trading assistant designed to enhance the experience of active traders and investors. By offering rapid and objective chart analysis, it enables users to evaluate U.S.-listed stocks without the hassle of manual guesswork. This innovative tool identifies key technical patterns, support and resistance levels, and momentum trends, providing users with clear scenarios and confidence scores to assist in their trading decisions. As traders seek out alternatives to Tradepal, they often do so for various reasons such as pricing, specific feature sets, or compatibility with their existing platforms. When evaluating alternatives, it's essential to consider factors like ease of integration into your current workflow, the comprehensiveness of the analysis tools offered, and how well the alternative aligns with your trading strategy and objectives. The right choice should enhance your trading efficiency while maintaining the level of insight you require.