Dividend Data vs The World Now
Dividend Data
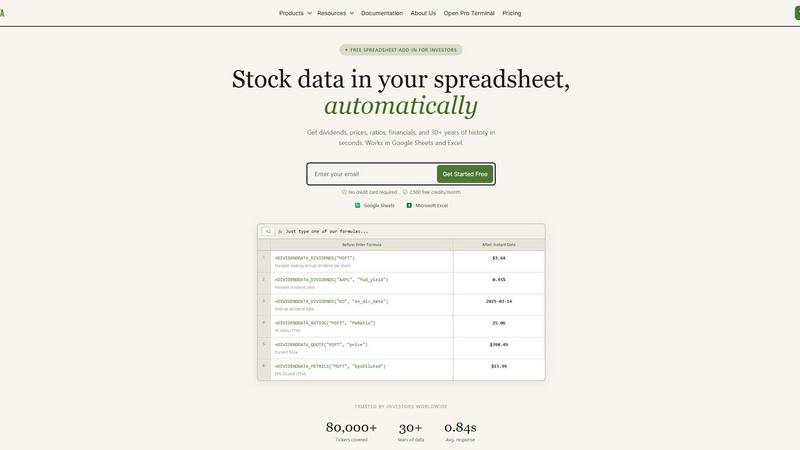
Stop manually updating spreadsheets; our battle-tested formulas instantly deliver dividends, prices, and financials directly into Excel and Google.
Last updated: March 11, 2026
The World Now
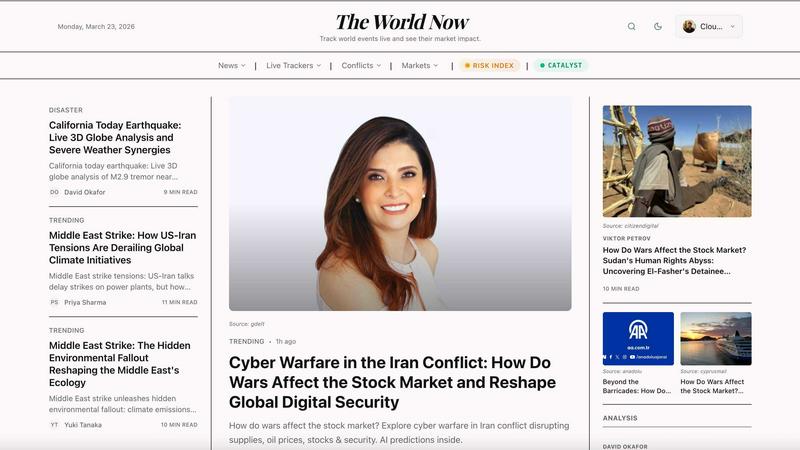
Track global events live and dominate the markets with real-time insights that leave traditional news in the dust.
Last updated: March 26, 2026
Visual Comparison
Dividend Data
The World Now
Feature Comparison
Dividend Data
Comprehensive Dividend Intelligence Engine
Go beyond basic yield. This feature delivers the deep, forward-looking data dividend investors crave. Access forward annual dividend amounts, yields, payout ratios, growth rates, and critical dates like ex-dividend and payment dates for any stock instantly. It's built specifically to analyze the sustainability and growth trajectory of income streams, putting professional-grade dividend analytics at your fingertips with a single formula.
Deep Historical Financials & Ratios
Conduct thorough fundamental analysis without leaving your spreadsheet. Pull in 30+ years of historical data from income statements, balance sheets, and cash flow statements. Instantly calculate and retrieve essential valuation and health metrics like P/E Ratio, Price-to-Book, Debt-to-Equity, and Return on Equity. This turns your sheet into a dynamic financial modeling platform, allowing for robust back-testing and trend analysis.
Live Price & Market Data Integration
Keep your portfolio tracking and valuation models perpetually up-to-date. With simple functions, pull real-time or delayed closing prices, market capitalization, and daily price history. This seamless integration ensures your net worth calculations, performance charts, and alert systems are always reflecting the live market, eliminating manual data entry errors and outdated information.
Universal Spreadsheet Compatibility
Why choose between ecosystems? Dividend Data delivers identical, powerful functionality in both Google Sheets and Microsoft Excel. Whether your team uses Google Workspace or your models are built in Excel, you get the same reliable formulas, data quality, and user experience. This flexibility ensures no investor is left behind and allows for seamless collaboration across different platforms.
The World Now
Live 3D Global Event Globe
Visualize global volatility as it happens on an immersive, interactive 3D globe. This isn't a static map; it's a live feed updated every five minutes, pinpointing active wars, missile strikes, earthquakes, volcanic eruptions, and political crises. See the precise location and scale of events, from a factory fire in Daejeon to escalating settler violence in the West Bank, providing unparalleled situational awareness that flat maps and news tickers simply cannot match.
Catalyst AI Market Prediction Engine
This is the core of your competitive advantage. Catalyst is the proprietary AI engine that directly connects geopolitical and disaster events to financial market movements. It analyzes live events and forecasts their impact on 28 key assets, including cryptocurrencies, commodities, and indices. It provides a clear severity rating, directional prediction (up/down), and a published track record, transforming breaking news into a quantifiable trading signal before traditional analysis catches up.
AI-Generated Breaking News & Analysis
Within minutes of an event being detected on the globe, The World Now's AI generates concise, factual breaking news reports. This feature ensures you get the "what" and "where" instantly, bypassing editorial delays. Furthermore, deep-dive analysis articles, like those on silver price predictions or the market impact of aviation disasters, are produced to give context and connect events to broader economic and financial trends.
Global Risk Index & Specialized Trackers
Go beyond single events with synthesized risk intelligence. The Global Risk Index combines live data on conflict, disaster, and economic stress into a single, comparable metric for countries worldwide. Additionally, access over 30 dedicated tracker pages for focused monitoring, such as the current wars list, live earthquake feed, Doomsday Clock status, and country-specific danger rankings, allowing for both macro and micro risk assessment.
Use Cases
Dividend Data
Automated Dividend Portfolio Tracking
Manually updating a portfolio of income stocks is a tedious chore. Investors use Dividend Data to build a live dashboard that automatically tracks dividend payments, yields-on-cost, projected annual income, and ex-dividend calendars. This automates the entire monitoring process, providing a real-time view of portfolio income health and freeing up hours for analysis instead of data entry.
Screening and Building Watchlists
Quickly filter the universe of 80,000+ stocks based on precise, live criteria. Use the formulas to create dynamic screens for stocks meeting specific conditions, such as a P/E ratio under 20, a dividend yield above 3%, and a payout ratio below 60%. This allows investors to systematically identify new opportunities based on the latest data without relying on third-party screeners with limited metrics.
Streamlined Fundamental Research Reports
When analyzing a company for a potential investment, gathering data from multiple sources is inefficient. With Dividend Data, an investor can create a standardized research template in a spreadsheet. By simply entering a ticker symbol, the template auto-populates with decades of financials, key ratios, and dividend history, creating a comprehensive, consistent report in seconds.
Dynamic Financial Modeling & Projections
Build more accurate and responsive financial models. By linking valuation models directly to live data feeds for revenue, EPS, and growth rates, analysts can ensure their assumptions and projections are grounded in the latest reported figures. This creates living models that adjust as new quarterly data is released, providing a significant edge in investment thesis development.
The World Now
Quantitative Hedge Fund Analysis
Fund managers and quants use The World Now to inject real-time geopolitical alpha into their models. Catalyst's structured, severity-rated predictions on asset impact provide a unique, alternative data stream to backtest and automate trading strategies, aiming to capitalize on market inefficiencies created by sudden global shocks that most datasets miss.
Journalistic Breakthrough Reporting
Journalists and news agencies leverage the platform to break stories faster and with greater depth. The live globe and AI news generation provide instant leads on developing crises, while the market impact analysis allows for sophisticated reporting on the economic ramifications of events, setting their coverage apart from competitors.
Corporate Risk & Supply Chain Management
Global corporations monitor the Global Risk Index and specific disaster trackers to proactively protect assets, personnel, and supply chains. Real-time alerts on earthquakes, political unrest, or conflicts in key regions enable swift contingency planning and operational adjustments to mitigate disruption and financial loss.
Retail Investor Edge
Active retail traders and sophisticated investors use the platform to level the playing field against institutional players. By receiving clear, AI-driven signals on how a Middle East strike might affect oil prices or how a disaster could move crypto markets, they can make informed, timely decisions without needing a full-time research desk.
Overview
About Dividend Data
Forget clunky APIs, expensive terminals, and the endless copy-paste grind. Dividend Data is the battle-tested spreadsheet weapon built for one purpose: to give self-directed investors institutional-grade market intelligence without the institutional complexity or price tag. This is not just another data feed; it's a complete operational system designed by a dividend investor for fundamental analysts who live in Google Sheets and Microsoft Excel. The core value proposition is ruthless efficiency: you get instant, live access to over 30 years of historical data for 80,000+ tickers directly in your cells through simple, plain-English formulas. No coding, no API keys, no manual updates. Just type a function like =DIVIDENDDATA_DIVIDENDS("MSFT") and watch the forward dividend, yield, ex-date, or payout ratio populate instantly. It brings together dividends, yields, full financial statements, key ratios, earnings, and price history—over 100 metrics—transforming your spreadsheet from a static record into a dynamic, real-time research and portfolio tracking powerhouse. With a permanently free tier offering 2,500 monthly credits and seamless integration across both major spreadsheet platforms, Dividend Data democratizes high-quality financial data, empowering investors to make faster, more informed decisions with confidence.
About The World Now
In the high-stakes arena of global finance and news, information is power, but speed is everything. The World Now is the definitive real-time intelligence platform that doesn't just report on global crises—it predicts their financial fallout. While traditional news outlets scramble to confirm facts and legacy market data tools look backward, The World Now provides a decisive, forward-looking edge. It combines a live 3D globe tracking conflicts, disasters, and geopolitical risks with Catalyst, a battle-tested AI prediction engine that forecasts market impact. This platform is engineered for a specific breed of professional: the investor, analyst, or journalist who cannot afford to wait. It answers the critical question others ignore: "What just happened, and what will it do to my portfolio?" By synthesizing live event data from sources like USGS, NASA, and GDELT with proprietary AI analysis, The World Now delivers actionable intelligence on asset movements across Bitcoin, gold, oil, and major indices minutes—sometimes hours—before the mainstream narrative forms. This isn't passive observation; it's active foresight built for those who need to understand and act on world events before the market has fully priced them in.
Frequently Asked Questions
Dividend Data FAQ
Is there really a free plan, and what does it include?
Absolutely. The free tier is a permanent offering, not a limited trial. It provides 2,500 credits per month at no cost and with no credit card required. This is ample for most individual investors to track a portfolio, research several companies, and automate key data in their spreadsheets, making professional-grade analysis accessible to everyone.
How does Dividend Data compare to using free Yahoo Finance or Google Finance data?
While those sources are free, they are notoriously unreliable, inconsistent, and often lack the depth and history serious investors need. Dividend Data provides clean, standardized, and battle-tested data directly into your spreadsheet cells with 30+ years of history. You trade the fragility of web scraping and manual copying for robust, automated, and institutional-quality data feeds.
Do I need to know how to code or set up an API?
Not at all. Dividend Data requires zero coding knowledge. The entire system runs on simple, custom spreadsheet functions (like =DIVIDENDDATA_QUOTE("AAPL", "price")). If you know how to type a formula in Excel or Google Sheets, you can use all its features. There are no APIs to manage, authenticate, or troubleshoot.
Is my data secure and private?
Yes. Dividend Data operates with a strong commitment to privacy. Your spreadsheet data and portfolio holdings are not stored on their servers. The add-in fetches public market data based on the formulas you type. You maintain full control and ownership of your financial models and investment information at all times.
The World Now FAQ
How accurate is the Catalyst AI prediction engine?
Catalyst's accuracy is built on continuous machine learning from a vast historical corpus of event-market correlations. Its performance is not based on claims but on a published track record that users can audit. While no prediction engine guarantees 100% accuracy, Catalyst provides statistically-backed severity ratings and directional forecasts designed to identify high-probability market movements ahead of conventional analysis.
What sources does The World Now use for its live data?
The platform aggregates and verifies data from premier global sources to ensure reliability. This includes geological data from USGS, fire and thermal activity from NASA FIRMS, conflict data from ACLED, global news and sentiment from the GDELT Project, and official aviation/shipping data, creating a comprehensive and trustworthy real-time picture.
How is this different from Bloomberg or Reuters terminals?
Bloomberg and Reuters are exceptional for financial data and news, but they are not built as real-time geopolitical risk engines with integrated market prediction. The World Now specializes in the crucial, causal link between a live global event and its market impact, delivering synthesized, forward-looking signals often before those traditional services have fully contextualized the event itself.
Can I use this for long-term investment research?
Absolutely. While powerful for real-time alerts, the platform is equally valuable for research. The archive of AI analysis, historical risk index data, and specialized trackers allows investors to study patterns, understand regional stability, and assess how specific types of crises have historically affected different asset classes over time.
Alternatives
Dividend Data Alternatives
Dividend Data is a specialized spreadsheet add-on that delivers live, institutional-grade stock market data directly into Google Sheets and Excel. It belongs to the category of financial data tools built for self-directed, fundamental investors who prioritize dividends and long-term analysis. Users often explore alternatives due to budget constraints, the need for different data points, or compatibility issues with other platforms like portfolio trackers. When evaluating other tools, savvy investors should scrutinize the depth of historical data, the transparency of pricing beyond free trials, and the simplicity of the user experience. The core value lies in eliminating manual data entry; therefore, any true alternative must offer seamless, formula-driven access without requiring coding skills or constant maintenance. The right solution should feel like a natural extension of your analysis workflow, not a complicated piece of financial software. Focus on tools that understand the specific needs of dividend growth investing, providing not just raw numbers but the critical metrics—like payout ratios and dividend growth streaks—that inform sound investment decisions.
The World Now Alternatives
The World Now is a premium real-time global insights platform in the business and finance intelligence category. It delivers live geopolitical and disaster tracking fused with AI-powered market impact forecasts, designed for professionals who need an edge. Users may seek alternatives for various reasons, including budget constraints, a need for a specific feature set like deeper historical analysis, or a preference for a different platform such as a mobile-first experience or a simpler desktop dashboard. When evaluating alternatives, prioritize the core value: the speed and accuracy of event detection, the sophistication of the market impact analysis, and the overall reliability of the data. The best tool is one that seamlessly integrates real-world events with actionable financial intelligence tailored to your specific needs.